GeoApps Logo
Apps
Solutions
Platform
About us
Get adviceLogin
Hero background
  1. Home
  2. Solutions
  3. Energy Transition

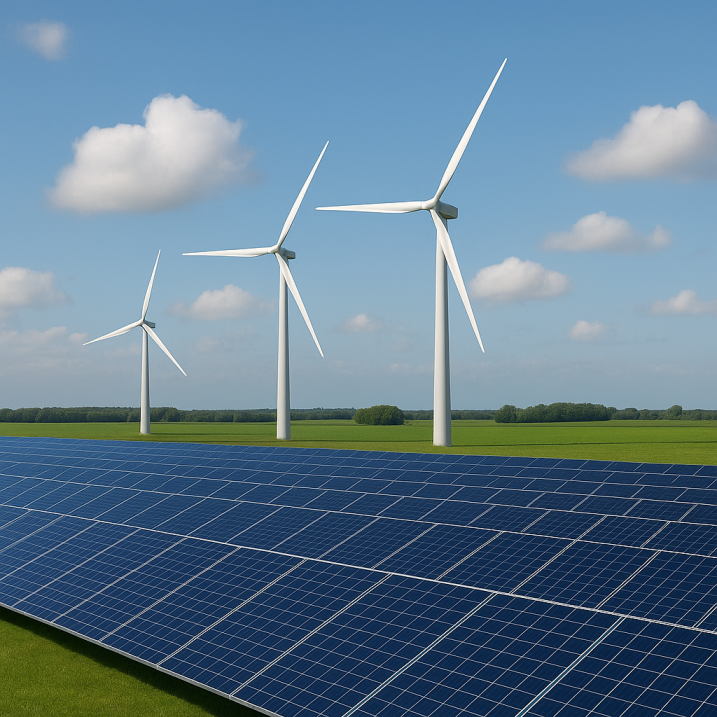
Accelerate the energy transition with clear insights

Use maps and scenarios to make the energy transition and sustainable development concrete. GeoApps helps you visualize opportunities and bottlenecks: from solar and heat locations to energy poverty and grid congestion. This way, you accelerate the energy transition with maps, insights, and analyses, and make better choices faster that truly make a difference for a sustainable future.

Who uses GeoApps for Energy & Sustainability?

Discover how GeoApps helps organizations optimize their operations

Municipalities

Municipalities

Municipalities

With GeoApps, you can see at a glance where opportunities for solar energy lie. By combining current aerial photos, 3D data, and usage data, a complete picture of suitable roofs and areas is created.

GeoApps
Utilities

Utilities

Utilities

GeoApps makes it clear where heat from water or sewers can contribute to the energy transition. By combining data on surface water, sewer, buildings, and heat demand, you get concrete insight into opportunities for aquathermy and riothermy.

GeoApps
Consultancies

Consultancies

Consultancies

Identify where bottlenecks and opportunities lie in the energy grid and design smart energy hubs where local generation, storage, and use come together.

GeoApps
Provinces & Regions

Provinces & Regions

Provinces & Regions

Regional energy transition strategies and sustainable development planning for provincial governments.

GeoApps

Trusted by leading organizations in energy

  • Enexis
  • Gemeente Rotterdam
  • Duurzaamheidskaart
  • Stedin
  • Provincie Overijssel
  • Waternet
  • Gemeente Utrecht
  • Nouryon
  • Provincie Utrecht
  • Syntraal
  • Gemeente Enschede
  • Omgevingswarmtekaart
  • CCS Energie-advies
  • Gemeente Hengelo
  • Provincie Gelderland
  • Transitiemakers
  • Gemeente Apeldoorn
  • RVO
  • Qwello
  • Gemeente Maastricht
  • Provincie Noord-Holland
  • Arcadis
  • Gemeente Ede
  • Stantec
  • Gemeente Epe
  • Provincie Flevoland
  • Arup
  • Gemeente Gennep
  • Kragten
  • Gemeente Maasgouw
  • Provincie Groningen
  • Tauw
  • Gemeente Wierden
  • Roelofs
  • Gemeente Zundert
  • Provincie Drenthe
  • Roelofs Lemelerveld
  • Gemeente Haarlemmermeer
  • Dekker Groep
  • Gemeente Groningen
  • Thius
  • Gemeente Deventer
  • Tijdlab
  • Gemeente Dordrecht
  • Mateboer
  • Gemeente Rijswijk
  • Aveco de Bondt
  • Gemeente Leiden
  • Riese & Geurts
  • Gemeente Sittard-Geleen
  • OMWB
  • Westerkwartier
  • TTE
  • KWR
  • Lycens
  • Nordend
  • Royal HaskoningDHV

Key benefits for energy and sustainability

Efficiency

Make sustainable energy production, storage, and transport smarter with clear maps and data analyses.

Targeted

Implement targeted measures to reduce grid congestion and achieve your climate and energy goals faster.

Monitoring

Follow projects and progress on the map and adjust in a timely manner with current data.

Example application: visualizing solar potential

With GeoApps, you can see at a glance where opportunities for solar energy lie. By combining current aerial photos, 3D data, and usage data, a complete picture of suitable roofs and areas is created.

  • Calculate the solar potential of buildings and neighborhoods
  • Select and rank promising locations for solar panels
  • Combine solar potential with energy consumption and grid capacity
  • Substantiate investments and policy choices with facts and maps
  • Track the development of generated solar energy over time
Example application: visualizing solar potential

Mapping sustainable heat sources

GeoApps provides insight into where heat from water or sewers can contribute to the energy transition. By combining data on surface water, sewage, buildings, and heat demand, you get a concrete view of opportunities for aquathermal and riothermal energy.

  • Map locations for aquathermal and riothermal energy
  • Select areas suitable for collective heating systems
  • Link heat potential to demand, grid capacity, and area characteristics
  • Substantiate regional and local heat plans with figures and maps
  • Monitor the effects and progress of projects in a targeted manner
Mapping sustainable heat sources

Grip on sustainable area development

With GeoApps, you record sustainability ambitions from the start and maintain control over progress throughout the entire process. Design choices become measurable, and the impact on energy, mobility, and quality of life becomes immediately clear.

  • Assess scenarios and plans on their sustainability score
  • Integrally weigh different themes such as energy, mobility, and biodiversity
  • Make the influence of design choices immediately visible
  • Establish measurable goals and KPIs and monitor progress
  • Work in a targeted manner on a healthy, future-proof living environment
Grip on sustainable area development

What does GeoApps deliver?

Example application: visualizing solar potential

Mapping sustainable heat sources

Grip on sustainable area development

Energy insights

"Thanks to GeoApps, we have gained good insight for the first time into where the greatest opportunities lie for solar energy on roofs. By smartly combining data with analysis tools, we can make targeted plans for collective actions with residents and companies. This way, we can take faster steps together in the energy transition."
René ten Tije, municipality of Groningen
Duurzaamheidskaart.nl

Partner Spotlight: Duurzaamheidskaart.nl

Accelerate the energy transition with maps, analyses and practical insights for policy and execution. Discover solar potential, heat sources, and sustainable energy opportunities.

Explore ESG Solutions
Partner Spotlight: Duurzaamheidskaart.nl

Please accept cookies to play this video

Related Apps

Discover our apps that perfectly complement this solution

Viewer

Viewer

Interactive map viewer for spatial data

Dashboard

Dashboard

Data visualization and analysis dashboard

Sustainability Map (ESG-Mapping)

Sustainability Map (ESG-Mapping)

Make sustainability data visible with interactive ESG-mapping

Fieldwork

Fieldwork

Mobile app for field data collection

Accelerate your energy transition

Discover how smart geo-insights help you achieve climate and energy goals faster.

Contact Us
GeoApps Viewer
Gasfabriek project
MapGear team office

GIS/GEO for Energy Transition - Frequently Asked Questions

Answers about data, collaboration and implementation for energy transition workflows.

Which data sources can we connect for energy analysis?
Connect PDOK, BAG, BGT, Kadaster and your own PostGIS/ArcGIS endpoints. Import data about buildings, energy networks, solar panels and heat sources; publish selected layers securely.
How does solar potential analysis work?
GeoApps enables you to calculate the solar potential of buildings and neighborhoods by combining current aerial photos, 3D data and usage data. You can select and rank promising locations for solar panels and combine solar potential with energy consumption and grid capacity.
Can we visualize opportunities for sustainable heat?
Yes. GeoApps provides insight into where heat from water or sewers can contribute to the energy transition. By combining data on surface water, sewage, buildings and heat demand, you get a concrete view of opportunities for aquathermal and riothermal energy.
How do we analyze smart grid integration?
GeoApps helps you identify where bottlenecks and opportunities lie in the energy grid. You can design smart energy hubs where local generation, storage and use come together, with clear spatial analyses.
What does onboarding include?
Setup, data ingest, roles/permissions, training and handover. Typical onboarding is 2–4 weeks depending on scope. Sometimes we run a pilot for a quarter with organizations moving from old GIS stacks, or who are starting to use WebGIS for the first time.
Do you support custom development for energy projects?
Yes. We provide integrations and features on retainer or per project, with roadmap alignment and SLAs. This includes specialized tools for solar potential analysis, sustainable heat planning and energy grid integration.
How does pricing work?
We price via subscriptions, plus an onboarding fee and optional development fees if needed. We aim to be flexible. For details, see our subscriptions page.
GeoApps Logo

GeoApps is the leading software platform for GIS applications and spatial data, enabling organizations to make data-driven decisions.

Solutions

  • Urban Planning
  • Infrastructure
  • Real Estate
  • Environment & Climate
  • Energy Transition
  • Safety & Risk

Products

  • GeoApps
  • Solutions
  • Sustainability Map
  • MapServices
  • TouchTable
  • Consultation

Apps

  • Viewer
  • Dashboard
  • Fieldwork
  • MapTour
  • MapTalk
  • Custom

For whom?

  • Municipalities
  • Provinces
  • Environmental Services
  • Engineering
  • Contractors
  • Safety Regions

Platform

  • Integrations
  • Documentation
  • System Status
  • Changelog
  • Support
  • Subscriptions

Company

  • About Us
  • Careers
  • Contact
  • Partners
  • News & Blog
  • Events

Stay up-to-date

Subscribe to our newsletter to get the latest updates on our products and services. You can unsubscribe at any time.

Keep an eye on our socials too

Stay connected with us through our social media channels and get the latest updates on our products and services.

Quality & trust

MapGear is ISO 9001 and ISO 27001 certified and meets the highest quality and security standards for our products and services.

ISO 9001 Certificering
ISO 27001 Certificering
QGIS Membership 2026

© 2026 GeoApps, a product of MapGear B.V.

Privacy PolicyTerms of Service