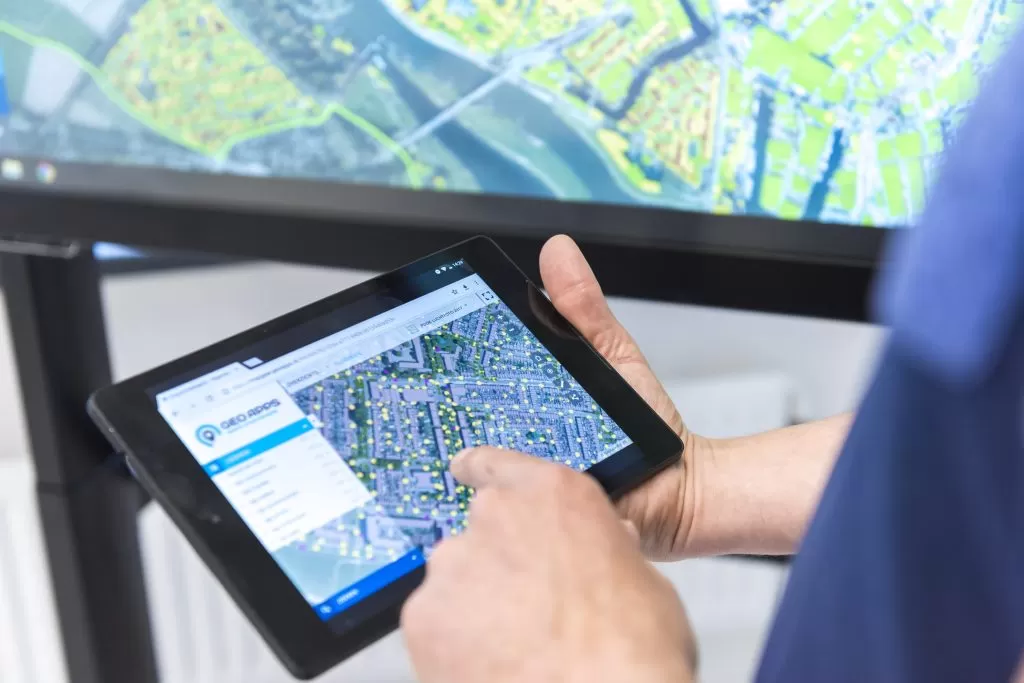
For RESU16 (Regional Energy Strategy Utrecht Region), we mapped over 700,000 solar panels!
Across 16 municipalities, it’s now precisely known where solar panels are installed, and where the potential for new panels remains high.
With Duurzaamheidskaart Pro, we visualized which neighborhoods still have strong potential and what types of buildings this involves (e.g., homes, offices, schools, and community centers). These insights are used by RESU16 as quantitative input for regional solar energy policy.
Manual vs AI / Machine Learning
An automatic algorithm might detect faster, but this technology is expensive and often less accurate.
Due to color differences and shadows in aerial images, solar panels can be difficult for algorithms to distinguish.
A trained operator, however, can usually recognize whether it’s a real PV installation or just something that looks similar, resulting in better accuracy and quality.
Insight into PV Installation Growth
Our GeoApps mapping application serves as the foundation for accurately detecting and recording solar panel installations, making the data also available as a geographic dataset.
The built-in analysis tool additionally provides a reliable projection of how many solar panels there will be in 5 or 10 years.
This allows RESU16 and the Utrecht municipalities to gain better insight into expected PV installation growth in the coming years.
Next Project Will Be Even Bigger!
Our innovative workflow has not gone unnoticed.
We are now set to start work for Province of Limburg, to detect solar panels across an area of 2,209 km².
Together with an external team of professional geo-operators from Bee4GIS, we aim to deliver the results within just a few weeks!

 Dashboard
 Custom Apps